Limits of Applicability
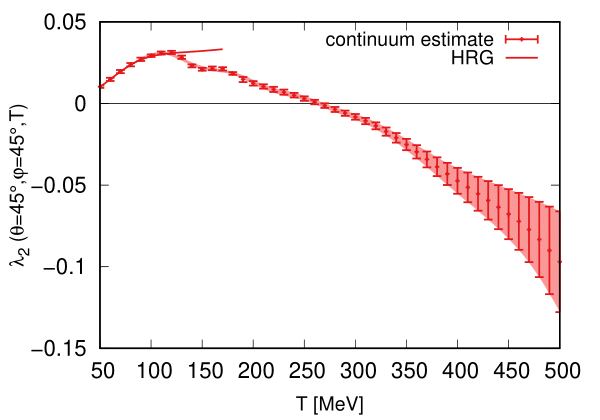
We estimate the limits of applicability of our expansion, based on physics arguments, as follows. The generalized density \(X_1(T)\) is expected to be a monotonically increasing function for a fixed value of \(\hat{\mu}\), in the absence of a first-order phase transition. As defined, \(X_1(T,\hat{\mu})\) is constructed from \(X_2(T',0)\), which is also a monotonically increasing function of \(T'\).
Thus, we conclude that \(T'(T)\) must be a monotonically increasing function, and if it is not, our expansion breaks down. This behavior is purely due to the truncation of the expansion of \(T'(T)\) in terms of \(\hat{\mu}\) at leading order (LO).
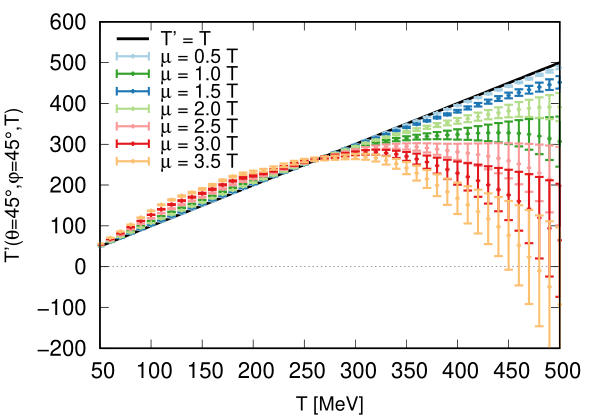
We estimate the range of validity of our expansion by identifying the value of \(\hat{\mu}\) above which we observe non-monotonic behavior in \(T'(T,\hat{\mu})\), i.e., where \(dT'/dT < 0\).
In the figure above, we show \(T'(T,\hat{\mu})\) in the direction \((\theta = 45^\circ, \varphi = 45^\circ)\) for different values of the chemical potential. For each temperature, there is a minimum value of \(\hat{\mu}\) above which \(dT'/dT\) becomes negative: in this regime, our extrapolation breaks down.
Limit of applicability plot for certain specific directions
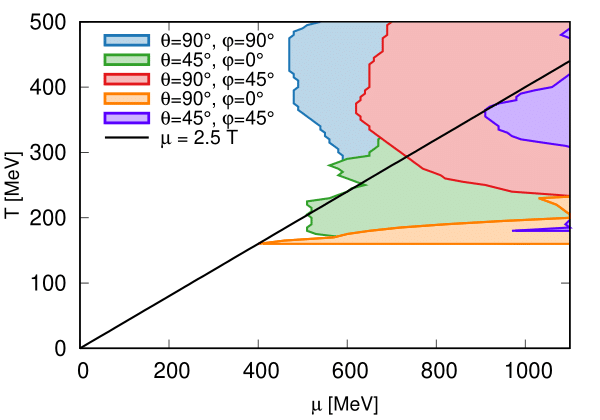
In this section, we display the regions where the expansion should break down based on \(dT'/dT\) going negative. These regions are shown on 2D projections in terms of \(T\) and \(\mu\). Specific directions were chosen to illustrate the limits of applicability of the expansion for the following cases: | - \(\theta = 90^\circ, \varphi = 90^\circ\) (pure strangeness direction) | - \(\theta = 45^\circ, \varphi = 0^\circ\) (baryon and charge direction) | - \(\theta = 45^\circ, \varphi = 45^\circ\) (baryon, charge, and strangeness direction) | - \(\theta = 90^\circ, \varphi = 45^\circ\) (baryon and strangeness direction) | - \(\theta = 90^\circ, \varphi = 0^\circ\) (pure charge direction)
A line of constant \(\mu_i / T = 2.5\), which is the expected limit of application of the standard Taylor expansion, is shown on the plot as a reference.
In any direction of the four-dimensional phase diagram, the code will print a warning if the extrapolation is attempted beyond the limit of applicability, and will skip the calculation for that point.
Further stability checks of the equation of state based on the causality and stability conditions will also be implemented in the future.